

The SUPR-Q (Standardized User Experience Percentile Rank Questionnaire) is an 8 item questionnaire developed by MeasuringU that is used to measure the quality of the user experience. What actually impacts users likelihood to recommend?
At SEEK we’ve been experimenting with the SUPR-Q. We first ran it as part of a usability test in face to face research (n=5) to trial, and then went full scale using an on site Hotjar poll (n=1,811) to get a more representative sample for our first benchmark. The scores are expressed as percentiles which gives us an indication of how we compare to other websites on these facets.
What does the SUPR-Q ask?
7 of the questions use a 5-point Likert scale, with the 8th question being the standard 11-point NPS. The SUPR-Q measures quality (similar to satisfaction) as well as measures of usability, credibility, loyalty and apperance. These 4 aspects all impact the user experience of a product:
Usability:
- This website is easy to use.
- It is easy to navigate within the website.
Credibility: (Trust, Value & Comfort)
- The information on the website is credible.
- The information on the website is trustworthy.
Loyalty:
- How likely are you to recommend this website to a friend or colleague?
- I will likely visit this website in the future.
Appearance:
- I found the website to be attractive.
- The website has a clean and simple presentation.
Learnings from running the SUPR-Q
1. The NPS is impacted by the SUPR-Q
An interesting finding from our first experiment is that our NPS score dropped significantly (-5 points) from the last time we measured it. Originally my thought was that we had primed candidates to be negative by already asking them 7 other questions which resulted in the lower score. To test this we ran an NPS poll immediately after the SUPR-Q cohort, to the same sized sample. In the single question cohort the NPS had not only recovered, but increased from the previous score (+12 points).
Interestingly, the verbatim feedback for the SUPR-Q cohort was skewed towards aesthetic feedback, which we have not typically seen in our NPS feedback, nor did we see in the NPS only cohort sampled in the same month.
The SUPR-Q questions may have given users pause to think about their liklihood to recommend by first making them think about trustworthiness, credibility, usability and appearance. Perhaps this is actually a more reliable NPS score.
2. There is a large drop off in answering the questions
Only 1,811 of the 5,414 respondents who began the SUPR-Q answered all the questions. However, once a user had answered 2 questions they were much more likely to complete all 8, and after answering 4 questions 90% continued to complete all questions.
3. Tool limitations may be impacting the results
The large drop off was likely impacted by the limitations of the HotJar implementation — having to ask one quesiton at a time, without being able to indicate progress (e.g. 2 of 8), and not automatically advancing once an answer was selected. This drop off can likey be addressed by improving the survey design.
Another limitation of the HotJar implementation is that there is no horizontal scale (other than the NPS, where the 11-point scale cannot be altered). We then had to make a decision — do we change the 5 point scale to an 11 point scale and jeopardise the validity of the data, or do we present a horizontal scale vertically and risk skewing responses? We went with option B. While we didn’t see a large skew towards the Strongly Disagree response, there were 20 (of 84) free text comments imply the participant didn’t mean to select strongly disagree (e.g. “I’m definitely going to come back to this site again!” when they had selected Strongly Disagree to this quesiton) and it is impossible to know how many may have made this error without comment. 2 respondents explicitly mentioned in their text that they had accidentally clicked Disagree.
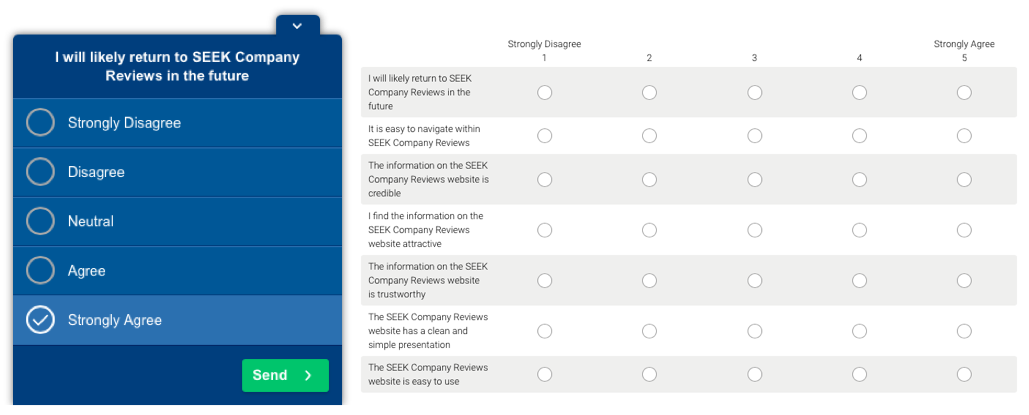
Left — How we presented the SUPR-Q. Right — How we will present it next time
What now?
- Does the SUPR-Q drag down the NPS?
- Will the NPS run on its own always be higher as it’s a single, easier to answer, question?
- Does the NPS asked in the SUPR-Q provide a more reliable, thoughtful answer?
- Will using a Survey Monkey intercept and a matrix / rating style question improve usability of the question itself, and therefore increase the scores and NPS?
- Does the NPS even tell us what users really mean anyway?
Read more: Does the NPS tell us what users really mean?
TL;DR
If you start reporting NPS collected via the SUPR-Q and you see a significant drop — don’t panic. Remember that changing the way you measure something will impact the end results, and wait until you have a run the SUPR-Q multiple times to make inferences about trends, re-calibrate and then continue to focusing on changes over time rather than what the raw figure is. Plus, make sure you communicate this change in measurement well to the business so they don’t freak out about a lower NPS!